
Why every CRO recommendation should map to a pipeline stage
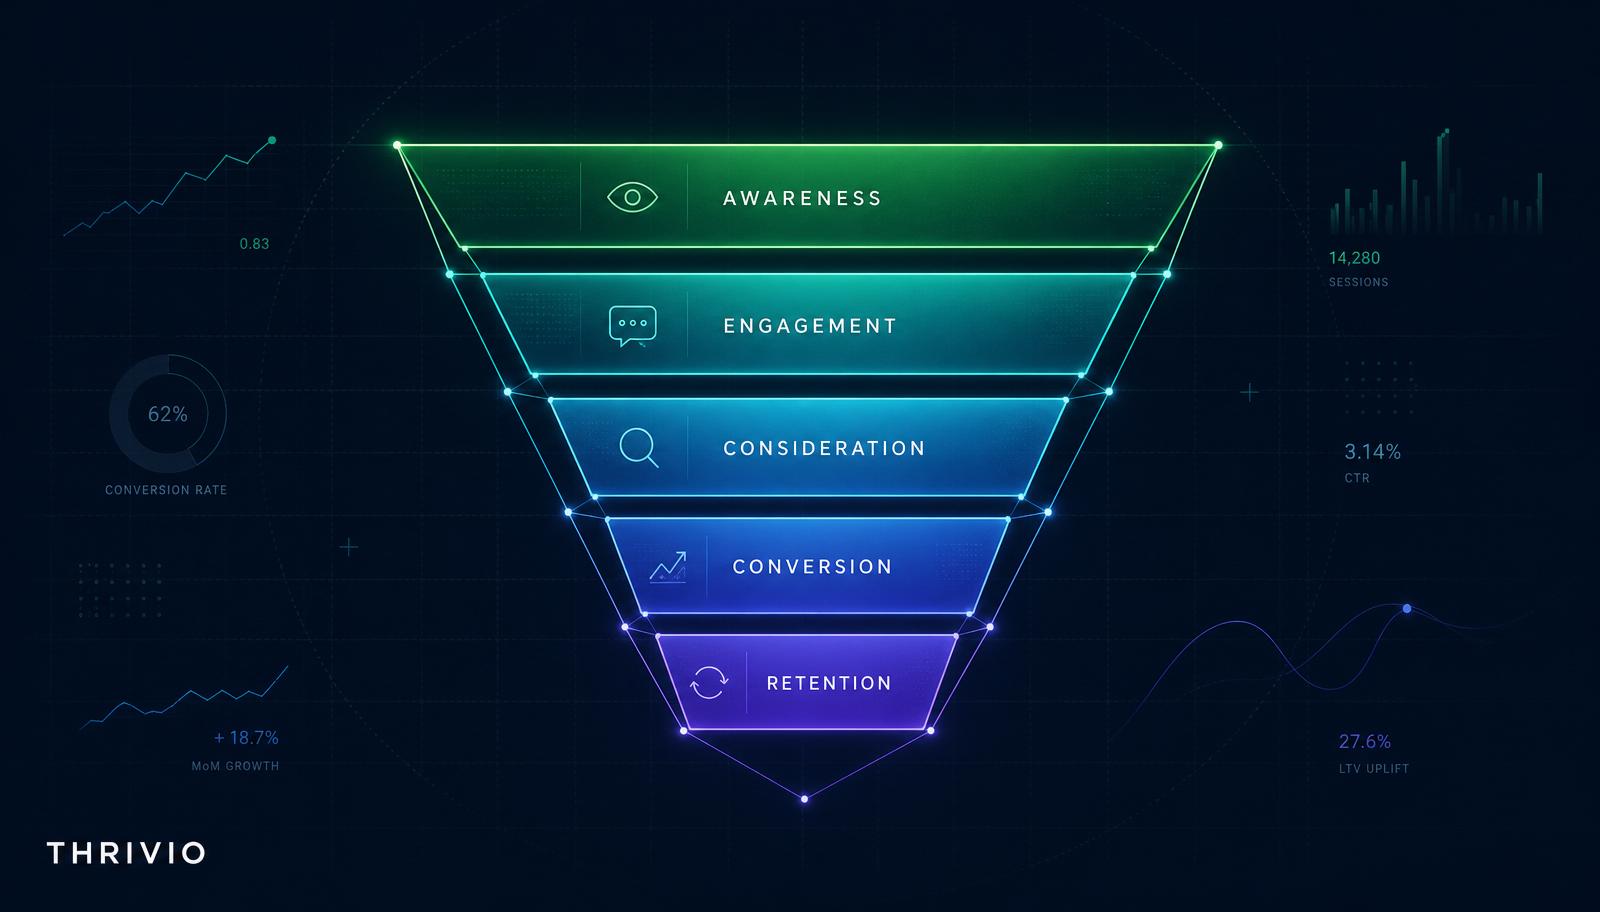
Most CRO audits hand you a 300-row export and leave you to guess which fix matters most. That is the wrong shape for a growth team. Growth teams think in pipeline stages — Awareness, Engagement, Consideration, Conversion, Retention — because that is how revenue is actually created and lost.
When every recommendation carries a stage tag, three things get easier:
- Prioritisation. You can see which stage is bleeding the most revenue and put your best people there first.
- Ownership. SEO owns Awareness. Product owns Consideration. Growth owns Conversion. The tag tells you who ships the fix.
- Measurement. You can compare projected lift stage-by-stage instead of arguing over vanity metrics like "site score went up 4 points."
We built a full sample CRO report on a fictional DTC skincare brand, glowbotanicals.co, to show what this looks like end to end. This post walks through it.
The sample site at a glance
- 148,000 monthly visits
- 2.1% conversion rate
- £42 average order value
- £131,000 monthly revenue
- Audit score: 62 / 100 (below the DTC beauty median of 68)
The audit projects a £38k–£54k monthly revenue uplift if all high-impact fixes ship. That is a 29–41% lift, and most of it lives in one stage — which is exactly the kind of insight the pipeline view surfaces.
Reading the funnel strip
The report opens with a five-stage funnel:
- Awareness — 148,000 visits. In-line with category, but blog traffic converts to email at 0.02% vs a 1.4% category median. That is the leak.
- Engagement — 94,200 sessions past the hero. Below category because four competing hero CTAs kill scroll depth.
- Consideration — 31,800 PDP visits. 63% never scroll to reviews.
- Conversion — 3,108 checkout starts. 41% abandon at the shipping step; no Apple / Google Pay.
- Retention — 612 repeat customers. Post-purchase email has no day-3 "how to use" sequence.
Each stage gets a benchmark line so you know whether the number is category-normal or category-bad. You want to spend on the bad ones first.
How we calculate projected lift
Every recommendation gets three numbers: impact, effort, and a projected lift in your reporting currency. The lift is grounded in two things:
- The gap between your current stage conversion and the category benchmark.
- The realistic capture rate of the fix (rarely 100% — usually 40–70% of the theoretical gap).
Two tools do the maths so you can size a fix on your own site:
- Conversion rate calculator — turns a small conversion-rate delta into a monthly revenue delta at your AOV.
- Statistical significance calculator — tells you whether a test result is real before you ship it.
If a recommendation would need 12 weeks of test data to reach significance at your traffic level, we say so. You do not want to burn a quarter on a test that will never conclude.
The 10 recommendations, by stage
The full sample report lists all 10 with evidence. A short version:
Awareness
- Add an exit-intent skincare quiz to /blog: +240 emails/mo.
- Rewrite metas and add Article schema on the top 3 posts: +12% organic CTR.
Engagement
- Collapse the homepage hero to a single "Shop bestsellers" CTA: +18% scroll-past-fold.
- Add filters (price, skin type, ingredient) to collection pages: +9% PDP clicks.
Consideration
- Move review summary above the fold on PDPs: +14% add-to-cart.
- Surface the bundle upsell as a visual "Complete the routine" module: +£3.20 AOV.
Conversion
- Enable address lookup and free-shipping bar in cart: +£14k/mo recovered.
- Cut the checkout form from 11 fields to 6: +7% completion.
- Enable Apple / Google Pay on mobile: +11% mobile conversion.
Retention
- Add a day-3 "how to use" post-purchase sequence: +6% repeat in 60 days.
Conversion holds the biggest single opportunity (~£29k/mo). That is why the impact chart puts it in the middle of the stack — visually obvious where to spend the next sprint.
The one page you should look at
The report itself is more useful than any summary. Open the sample CRO report and scroll through it. Every card shows the exact shape of what Thrivio hands your team when you run an audit on your own site — including the tool links you would use to size the fix, and the pipeline stage that tells you who owns it.
When you are ready to run this on your own domain, book a demo and we will scan your site in about two minutes.